Market Outlook
April 27, 2017
Market Cues
Domestic Indices
Chg (%)
(Pts)
(Close)
Indian markets are likely to open negative tracking the SGX Nifty and Asian markets.
BSE Sensex
0.6
190
30,133
U.S. Markets failed to hold earlier gains on Wednesday as investors digested
Nifty
0.5
45
9,352
President Donald Trump's outline for tax reform, while earnings season continued.
Mid Cap
(0.1)
(18)
14,763
The European markets endured a choppy trading session Wednesday, but the
Small Cap
(0.6)
(97)
15,283
majority of the markets finished with modest gains. Investors were in a cautious
Bankex
0.8
205
25,208
mood ahead of the Trump administration's big tax reform announcement later today
and tomorrow's meeting of the European Central Bank.
Global Indices
Chg (%)
(Pts)
(Close)
Indian Markets extended their record run on Wednesday and the rupee hit a 20-
Dow Jones
(0.1)
(21)
20,975
month high against the dollar as solid earnings, positive global cues and the MCD
poll win for BJP bolstered investor sentiment.
Nasdaq
(0.0)
(0)
6,025
FTSE
0.2
13
7,289
News Analysis
Nikkei
(01.1
210
19,289
Review: Axis Bank’s
Hang Seng
0.5
122
24,578
Detailed analysis on Pg2
Shanghai Com
0.2
6
3,141
Investor’s Ready Reckoner
Key Domestic & Global Indicators
Advances / Declines
BSE
NSE
Advances
1,925
1,496
Stock Watch: Latest investment recommendations on 150+ stocks
Refer Pg6 onwards
Declines
2,004
1,203
Unchanged
136
68
Top Picks
CMP
Target
Upside
Company
Sector
Rating
(`)
(`)
(%)
Volumes (` Cr)
Blue Star
Capital Goods
Accumulate
676
760
12.4
BSE
5,022
Dewan Housing Fin. Financials
Accumulate
432
460
6.5
NSE
29,462
Mahindra Lifespace
Real Estate
Buy
423
522
23.5
Navkar Corporation Others
Buy
209
265
26.8
KEI Industries
Capital Goods
Accumulate
213
239
12.0
#Net Inflows (` Cr)
Net
Mtd
Ytd
More Top Picks on Pg4
FII
( 326
(1,008)
43,212
MFs
450
6,332
15,770
Key Upcoming Events
Previous
Consensus
Date
Region
Event Description
Reading
Expectations
Top Gainers
Price (`)
Chg (%)
Apr 27, 2017 US
Initial Jobless claims
244.00
245.00
Apr 27, 2017 Euro Zone Euro-Zone Consumer Confidence
-3.60
-3.60
Balkrisind
1,569
6.9
Apr 27, 2017 US
GDP Qoq (Annualised)
2.10
1.00
Mcleodruss
192
6.1
Apr 28, 2017 Euro Zone ECB announces interest rates
0.00
0.00
Ceatltd
1,548
6.0
Apr 28, 2017 UK
GDP (YoY)
1.90
2.20
Niittech
457
4.9
Apr 30, 2017 UK
PMI Manufacturing
54.20
--
Skfindia
1,673
4.5
More Events on Pg5
Top Losers
Price (`)
Chg (%)
Adanient
120
(20.2)
Adanitrans
80
(5.5)
Prestige
253
(5.3)
Hathway
44
(4.3)
Hindpetro
538
(4.2)
#As on April 26, 2017
Market Outlook
April 27, 2017
News Analysis
Axis Bank Q4 net down 43% at `1,225cr
Private sector lender Axis Bank’s net profit declined 43.1% to `1,225cr for the
fourth quarter ended March 2017 on flat net interest income and rise in provisions
for stressed loans. It had posted net profit of ` 2,154cr in Janury- March 2016
(Q4Fy16).
The net profit for 2016-17 (FY17) dipped by 55.2% to ` 3,679cr from `8,223cr for
2015-16 (FY16). The board of bank has recommended dividend of `5 per share
for 2016-17.
The net interest income for the reporting quarter (Q4FY17) rose by 3.9% to
`4,729cr from `4,552cr in Q4FY16. The provisions and contingencies in Q4FY17
more than doubled to `2,581cr as against `1,168cr in same quarter last year.
Gross bad loans increased slightly to `21,280cr as of end-March from December,
but as a percentage of total loans were 5.04% at end-March, compared with
5.22% as of end-December.
The bank sold assets with a gross outstanding of `2,354cr and a net book value of
`1,828cr to ARCs against net sale consideration of `1,686cr comprising `266cr in
cash and `1,420cr in Security Receipts value. The capital adequacy ratio was
14.95% at end of March 2017.
Economic and Political News
Govt will not impose any tax on agriculture income, clarifies FM Jaitley
Housing sales up 13% in Jan-Mar at 51,700 units: PropTiger
Govt sanctions 1 lakh houses worth `4,200cr for urban poor
Corporate News
NTPC raises `2,000 crore via masala bonds for capital expenditure
Lakshmi Vilas Bank Q4 profit up 6%, at `52cr
Sterlite Tech's Q4 net rises 15% to `64cr
Quarterly Bloomberg Brokers Consensus Estimate
Kotak Mahindra Bank Ltd - Apr 27, 2017
Particulars ( ` cr)
4QFY17E
4QFY16
y-o-y (%)
3QFY17
q-o-q (%)
Net profit
920
696
32.2
880
4.6
Reliance Capital Ltd Consol - April 27, 2017
Particulars ( ` cr)
4QFY17E
4QFY16
y-o-y (%)
3QFY17
q-o-q (%)
Net profit
377
415
(9.3)
209
80.4
Market Outlook
April 27, 2017
Maruti Suzuki India Ltd - Apr 27, 2017
Particulars ( ` cr)
4QFY17E
4QFY16
y-o-y (%)
3QFY17
q-o-q (%)
Net sales
18,276
14,930
22.4
16,624
9.9
EBITDA
2,655
2,350
13.0
2,489
6.7
EBITDA margin (%)
14.5
15.7
15.0
Net profit
1,760
1,134
55.3
1,745
0.9
Federal Bank Ltd - Apr 28, 2017
Particulars ( ` cr)
4QFY17E
4QFY16
y-o-y (%)
3QFY17
q-o-q (%)
Net profit
227
10
2,113.9
206
10.5
Ambuja Cements Ltd - Apr 28, 2017
Particulars ( ` cr)
1QCY17E
1QCY16
y-o-y (%)
4QCY16
q-o-q (%)
Net sales
2,513
2,418
3.9
2,197
14.4
EBITDA
418
450
(7.0)
329
27.1
EBITDA margin (%)
16.6
18.6
15.0
Net profit
263
304
(13.5)
176
49.5
UPL Ltd Consol - Apr 28, 2017
Particulars ( ` cr)
4QFY17E
4QFY16
y-o-y (%)
3QFY17
q-o-q (%)
Net sales
4,897
4,292
14.1
3,855
27.1
EBITDA
1,135
981
15.7
750
51.3
EBITDA margin (%)
23.2
22.9
19.5
Net profit
665
560
18.7
459
44.8
Market Outlook
April 27, 2017
Top Picks ★★★★★
Market Cap
CMP
Target
Upside
Company
Rationale
(` Cr)
(`)
(`)
(%)
Strong growth in domestic business due to its leadership in
Alkem Laboratories
23,401
1,957
2,257
15.3
acute therapeutic segment. Alkem expects to launch more
products in USA, which bodes for its international business.
We expect the company would report strong profitability
Asian Granito
1,155
384
405
5.5
owing to better product mix, higher B2C sales and
amalgamation synergy..
Among the top 4 players in the consumer durables segment.
Bajaj Electricals
3,511
347
395
14.0
Improved profitability backed by turn around in E&P segment.
Strong order book lends earnings visibility.
Favourable outlook for the AC industry to augur well for
Cooling products business which is out pacing the market
Blue Star
6,462
676
760
12.4
growth. EMPPAC division's profitability to improve once
operating environment turns around..
With a focus on the low and medium income (LMI) consumer
Dewan Housing Finance
13,530
432
460
6.5
segment, the company has increased its presence in tier-II &
III cities where the growth opportunity is immense.
Strong loan growth backed by diversified loan portfolio and
Equitas Holdings
5,650
167
235
40.5
adequate CAR. ROE & ROA likely to remain decent as risk of
dilution remains low. Attractive valuations considering growth.
Economic recovery to have favourable impact on advertising
& circulation revenue growth. Further, the acquisition of a
Jagran Prakashan
6,331
194
225
16.2
radio business (Radio City) would also boost the company's
revenue growth.
High order book execution in EPC segment, rising B2C sales
KEI Industries
1,656
213
239
12.0
and higher exports to boost the revenues and profitability
Speedier execution and speedier sales, strong revenue visibilty
Mahindra Lifespace
1,736
423
522
23.5
in short-to-long run, attractive valuations
Massive capacity expansion along with rail advantage at ICD
Navkar Corporation
2,981
209
265
26.8
as well CFS augurs well for the company
Strong brands and distribution network would boost growth
Siyaram Silk Mills
1,594
1,701
1,872
10.1
going ahead. Stock currently trades at an inexpensive
valuation.
Market leadership in Hindi news genre and no. 2 viewership
ranking in English news genre, exit from the radio business,
TV Today Network
1,598
268
344
28.4
and anticipated growth in ad spends by corporates to benefit
the stock.
Source: Company, Angel Research
Market Outlook
April 27, 2017
Key Upcoming Events
Result Calendar
Date
Company
Apr 27, 2017
Maruti, TVS Motor, Kotak Mah. Bank, Shriram Trans.
Apr 28, 2017
CEAT, Ambuja Cements, IDFC, Federal Bank
May 1, 2017
Dabur India
May 2, 2017
Marico
May 3, 2017
ICICI Bank, Alembic Pharma
May 4, 2017
Exide Industries, Bank of Maharashtra, MRF
Source: Bloomberg, Angel Research
Global economic events release calendar
Date
Time
Country
Event Description
Unit
Period
Bloomberg Data
Last Reported Estimated
Apr 27, 2017
6:00PM US
Initial Jobless claims
Thousands
Apr 22
244.00
245.00
2:30PM Euro Zone
Euro-Zone Consumer Confidence
Value
Apr F
(3.60)
(3.60)
6:00PM US
GDP Qoq (Annualised)
% Change
1Q A
2.10
1.00
Apr 28, 2017
5:15PM Euro Zone
ECB announces interest rates
%
Apr 27
--
--
2:00PM UK
GDP (YoY)
% Change
1Q A
1.90
2.20
Apr 30, 2017
2:00PM UK
PMI Manufacturing
Value
Apr
54.20
--
May 2,, 2017 6:30AM China
PMI Manufacturing
Value
Apr
51.80
51.80
1:25PM Germany
PMI Manufacturing
Value
Apr F
58.20
--
May 3,, 2017 1:25PM Germany
Unemployment change (000's)
Thousands
Apr
(30.00)
--
11:30PM US
FOMC rate decision
%
May 3
1.00
1.00
2:30PM Euro Zone
Euro-Zone GDP s.a. (QoQ)
% Change
1Q A
0.50
--
May 4,, 2017 1:25PM Germany
PMI Services
Value
Apr F
54.70
--
May 5,, 2017 6:00PM US
Change in Nonfarm payrolls
Thousands
Apr
98.00
193.00
6:00PM US
Unnemployment rate
%
Apr
4.50
4.60
May 8,, 2017
China
Exports YoY%
% Change
Apr
16.40
--
May 10, 2017 7:00AM China
Consumer Price Index (YoY)
% Change
Apr
0.90
--
India
Imports YoY%
% Change
Apr
45.30
--
US
Producer Price Index (mom)
% Change
Apr
(0.20)
--
May 11, 2017
India
Exports YoY%
% Change
Apr
27.60
--
2:00PM UK
Industrial Production (YoY)
% Change
Mar
2.80
--
4:30PM UK
BOE Announces rates
% Ratio
May 11
0.25
--
May 12, 2017 5:30PM India
Industrial Production YoY
% Change
Mar
(1.20)
--
6:00PM US
Consumer price index (mom)
% Change
Apr
(0.30)
0.20
11:30AM Germany
GDP nsa (YoY)
% Change
1Q P
1.20
--
May 15, 201712:00PM India
Monthly Wholesale Prices YoY%
% Change
Apr
5.70
--
7:30AM China
Industrial Production (YoY)
% Change
Apr
7.60
--
Source: Bloomberg, Angel Research
Market Outlook
April 27, 2017
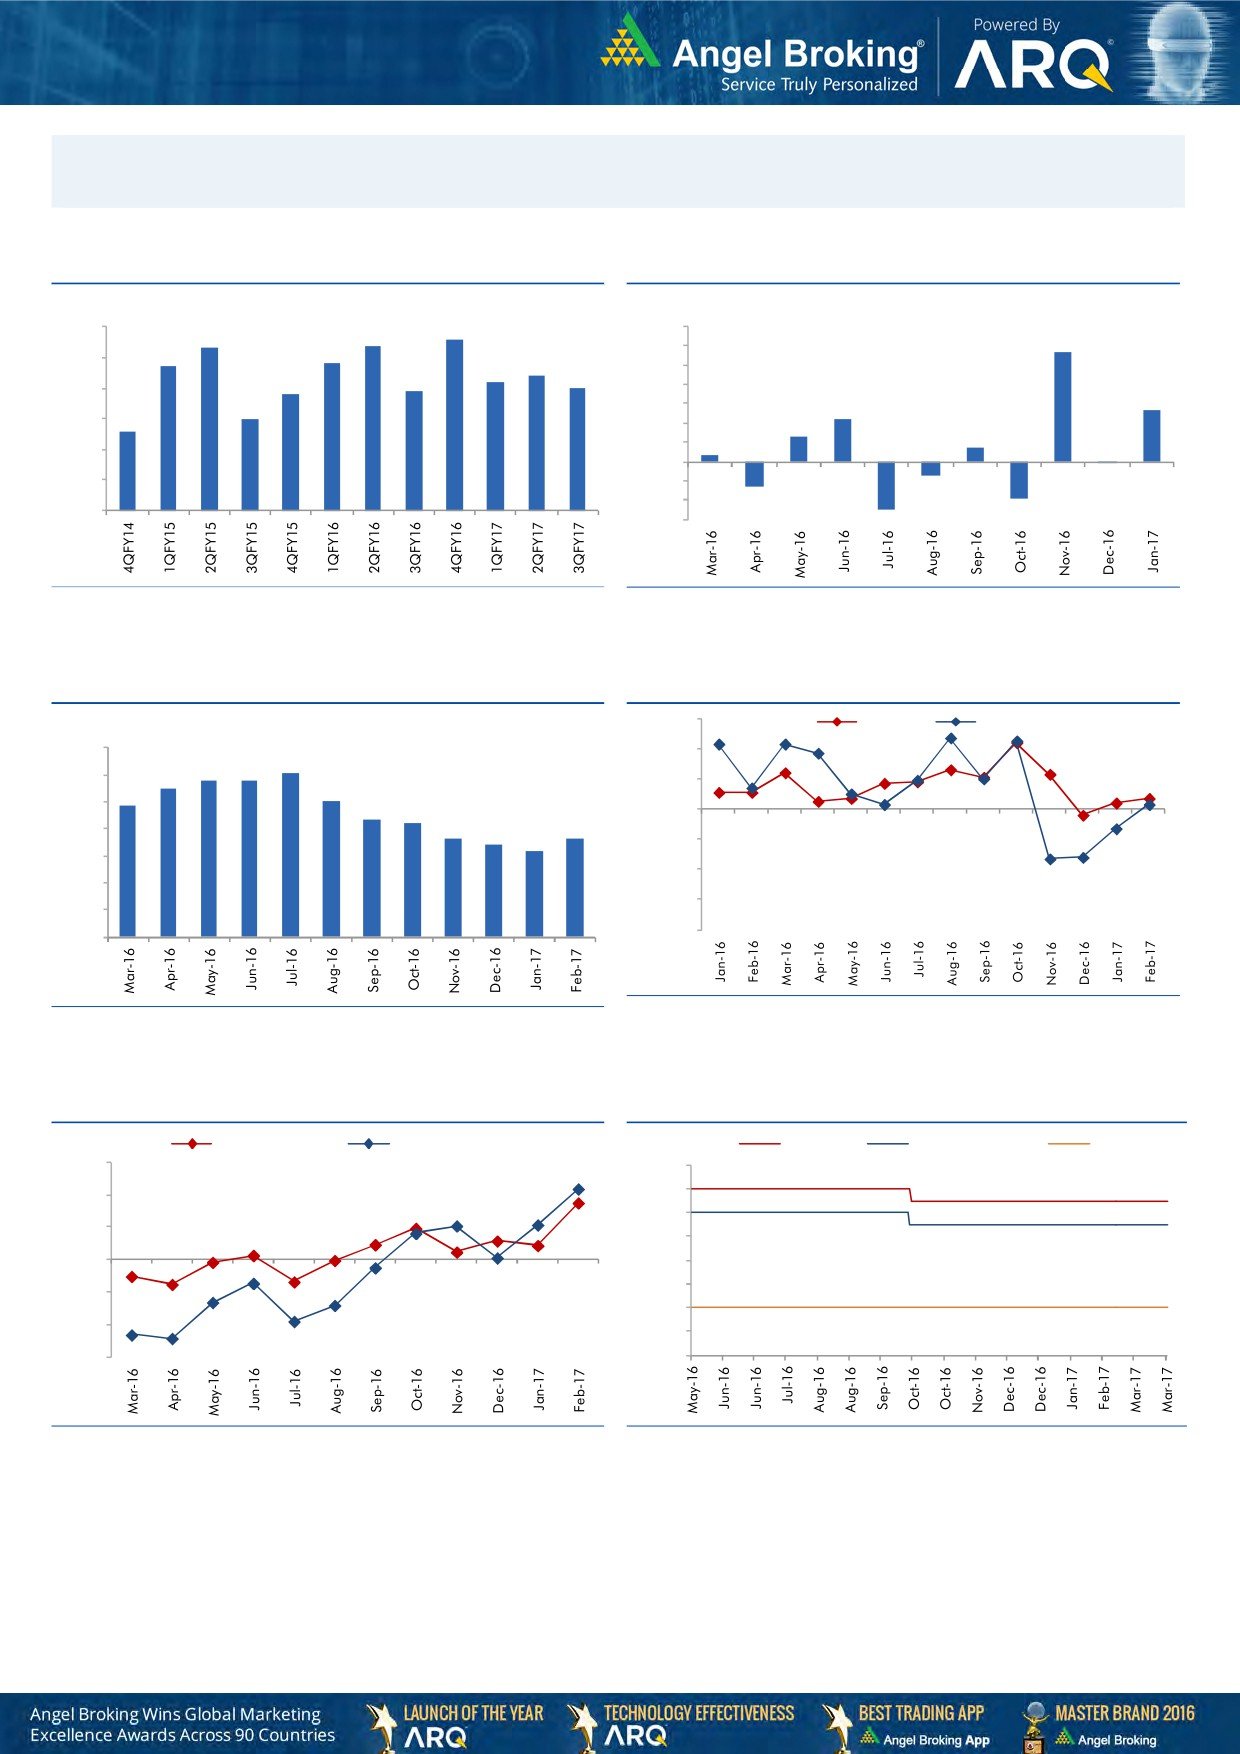
Macro watch
Exhibit 1: Quarterly GDP trends
Exhibit 2: IIP trends
(%)
(%)
9.0
8.4
8.6
7.0
8.3
5.7
7.7
7.8
6.0
8.0
7.4
7.2
5.0
6.8
6.9
7.0
7.0
4.0
2.7
6.0
3.0
2.2
6.0
5.6
1.3
2.0
0.7
1.0
0.3
5.0
-
4.0
(1.0)
(0.1)
(0.7)
(2.0)
3.0
(1.3)
(3.0)
(1.9)
(2.5)
Source: CSO, Angel Research
Source: MOSPI, Angel Research
Exhibit 3: Monthly CPI inflation trends
Exhibit 4: Manufacturing and services PMI
56.0
Mfg. PMI
Services PMI
(%)
7.0
54.0
6.1
5.8
5.8
6.0
5.5
5.1
52.0
4.8
5.0
4.3
4.2
50.0
3.6
3.7
4.0
3.4
3.2
48.0
3.0
46.0
2.0
44.0
1.0
42.0
-
Source: Market, Angel Research; Note: Level above 50 indicates expansion
Source: MOSPI, Angel Research
Exhibit 5: Exports and imports growth trends
Exhibit 6: Key policy rates
(%)
Exports yoy growth
Imports yoy growth
(%)
Repo rate
Reverse Repo rate
CRR
30.0
7.00
6.50
20.0
6.00
10.0
5.50
0.0
5.00
4.50
(10.0)
4.00
(20.0)
3.50
(30.0)
3.00
Source: Bloomberg, Angel Research
Source: RBI, Angel Research
Market Outlook
April 27, 2017
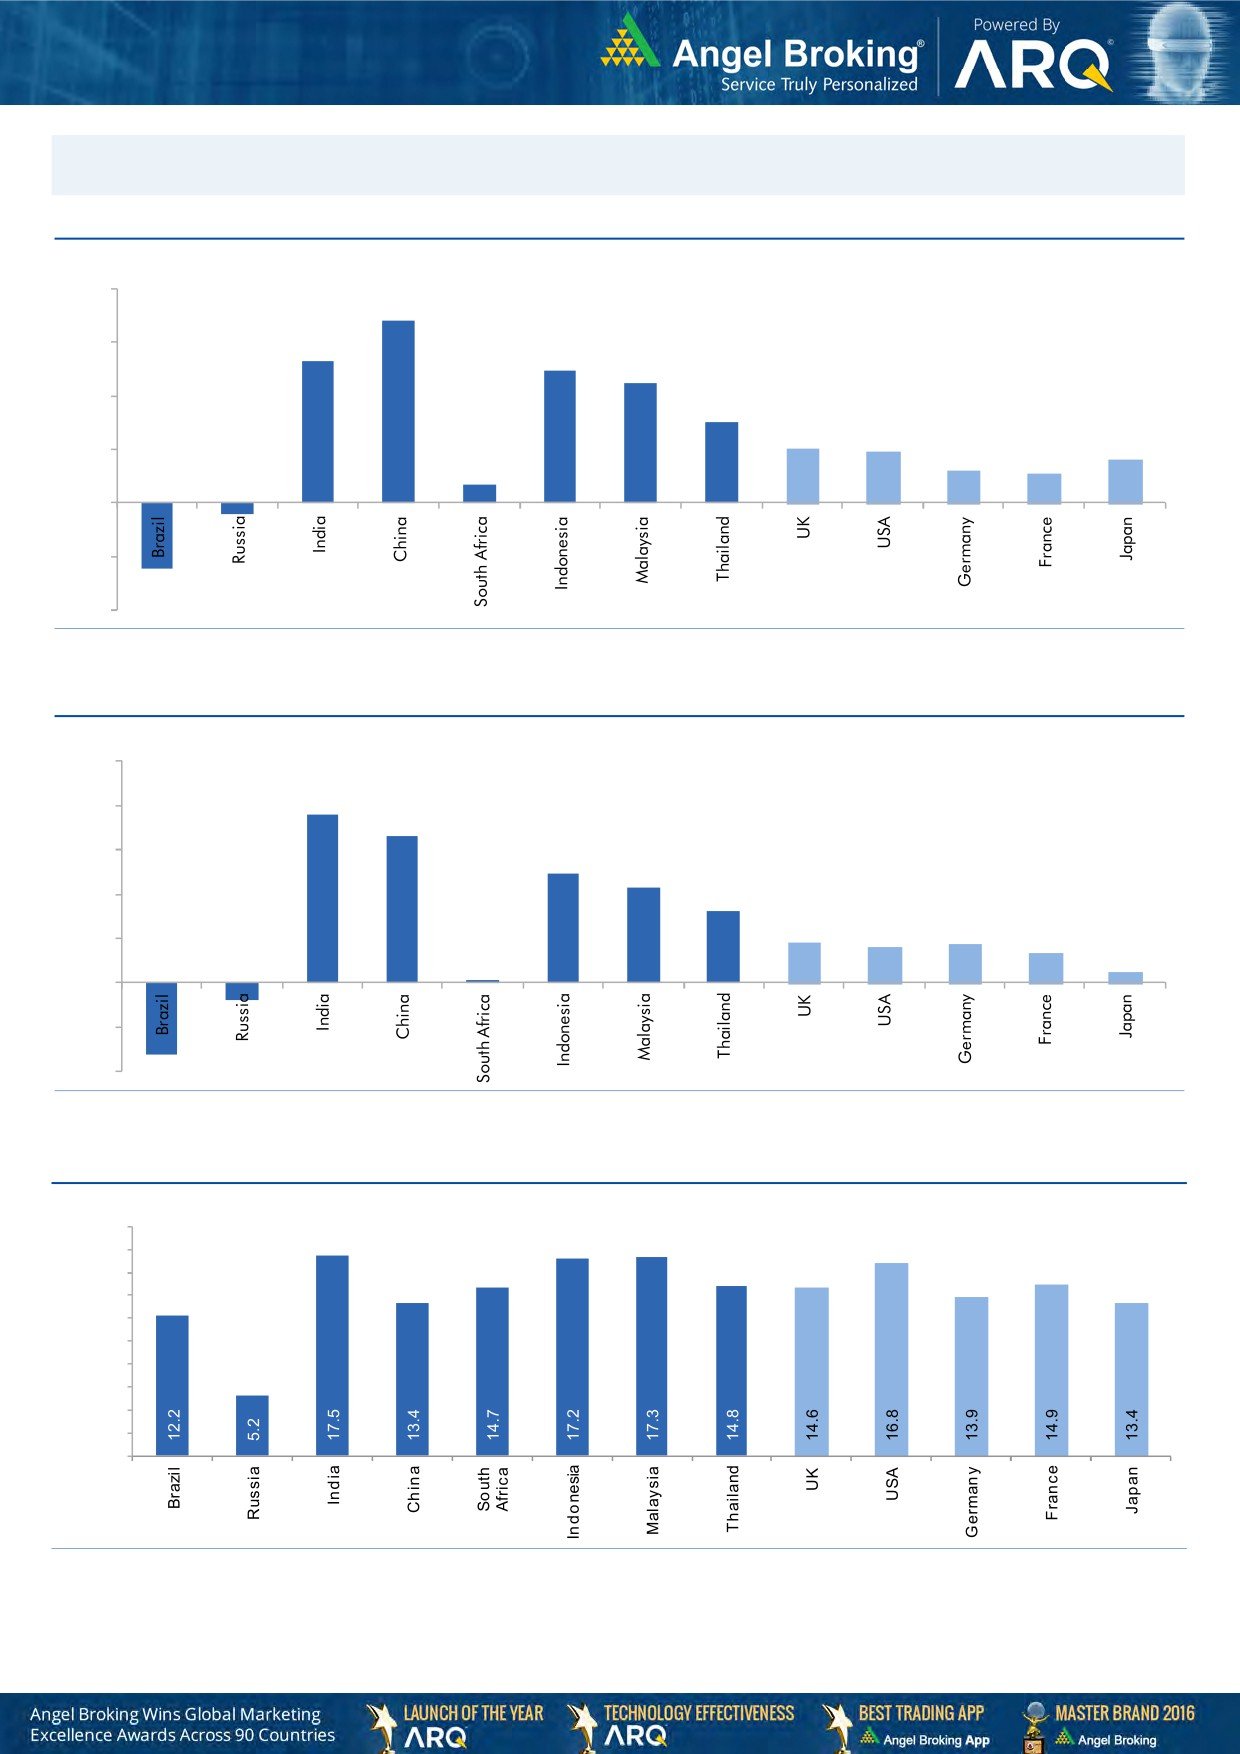
Global watch
Exhibit 1: Latest quarterly GDP Growth (%, yoy) across select developing and developed countries
(%)
8.0
6.8
6.0
5.3
4.9
0.7
4.5
4.0
3.0
2.0
1.9
2.0
1.2
1.6
1.1
-
(2.0)
(0.4)
(2.5)
(4.0)
Source: Bloomberg, Angel Research
Exhibit 2: 2016 GDP Growth projection by IMF (%, yoy) across select developing and developed countries
(%)
10.0
7.6
8.0
6.6
6.0
4.9
4.3
4.0
3.2
1.8
1.6
1.7
2.0
1.3
(0.8)
0.5
(3.3)
0.1
-
(2.0)
(4.0)
Source: IMF, Angel Research
Exhibit 3: One year forward P-E ratio across select developing and developed countries
(x)
20.0
18.0
16.0
14.0
12.0
10.0
8.0
6.0
4.0
2.0
-
Source: IMF, Angel Research
Market Outlook
April 27, 2017
Exhibit 4: Relative performance of indices across globe
Returns (%)
Country
Name of index
Closing price
1M
3M
1YR
Brazil
Bovespa
64,862
2.1
1.4
25.1
Russia
Micex
2,027
0.7
(6.8)
2.9
India
Nifty
9,352
2.9
10.9
18.4
China
Shanghai Composite
3,141
(4.7)
0.1
1.2
South Africa
Top 40
46,984
4.8
1.6
1.0
Mexico
Mexbol
49,565
1.8
7.0
8.9
Indonesia
LQ45
951
3.1
7.3
13.9
Malaysia
KLCI
1,769
1.4
5.8
3.5
Thailand
SET 50
997
0.5
2.5
13.3
USA
Dow Jones
20,975
1.8
5.3
16.3
UK
FTSE
7,289
(0.7)
1.9
15.3
Japan
Nikkei
19,289
1.6
1.2
18.5
Germany
DAX
12,473
3.6
7.6
25.6
France
CAC
5,288
5.1
9.5
22.4
Source: Bloomberg, Angel Research
Stock Watch
April 27, 2017
Company Name
Reco
CMP
Target
Mkt Cap
Sales ( Čcr )
OPM(%)
EPS (Č)
PER(x)
P/BV(x)
RoE(%)
EV/Sales(x)
(Č)
Price ( Č)
( Č cr )
FY17E
FY18E
FY17E
FY18E
FY17E
FY18E
FY17E
FY18E
FY17E
FY18E
FY17E
FY18E
FY17E
FY18E
Agri / Agri Chemical
Rallis
Neutral
241
-
4,678
1,937
2,164
13.3
14.3
9.0
11.0
26.7
21.9
4.7
4.1
18.4
19.8
2.5
2.2
United Phosphorus
Neutral
832
-
42,258
15,176
17,604
18.5
18.5
37.4
44.6
22.2
18.7
4.4
3.6
21.4
21.2
2.9
2.5
Auto & Auto Ancillary
Amara Raja Batteries
Accumulate
884
1,009
15,091
5,305
6,100
16.0
16.3
28.4
34.0
31.1
26.0
6.0
5.0
19.3
19.3
2.9
2.5
Apollo Tyres
Neutral
247
-
12,593
12,877
14,504
14.3
13.9
21.4
23.0
11.5
10.8
1.8
1.6
16.4
15.2
1.1
1.1
Ashok Leyland
Buy
88
111
24,944
20,021
21,915
11.6
11.9
4.5
5.3
19.5
16.5
4.0
3.5
20.6
21.5
1.2
1.1
Bajaj Auto
Neutral
2,888
-
83,571
25,093
27,891
19.5
19.2
143.9
162.5
20.1
17.8
5.6
4.8
30.3
29.4
3.1
2.7
Bharat Forge
Neutral
1,117
-
26,005
7,726
8,713
20.5
21.2
35.3
42.7
31.7
26.2
5.8
5.3
18.9
20.1
3.4
3.0
Ceat
Neutral
1,548
-
6,262
7,524
8,624
13.0
12.7
131.1
144.3
11.8
10.7
2.2
1.8
19.8
18.6
0.9
0.8
Eicher Motors
Neutral
26,041
-
70,859
16,583
20,447
17.5
18.0
598.0
745.2
43.6
34.9
14.9
11.3
41.2
38.3
4.1
3.3
Exide Industries
Neutral
230
-
19,584
7,439
8,307
15.0
15.0
8.1
9.3
28.4
24.8
4.0
3.6
14.3
16.7
2.2
2.0
Gabriel India
Neutral
125
-
1,799
1,544
1,715
9.0
9.3
5.4
6.3
23.2
19.9
4.4
3.9
18.9
19.5
1.1
1.0
Hero Motocorp
Neutral
3,310
-
66,094
28,083
30,096
15.3
15.7
171.8
187.0
19.3
17.7
6.7
5.7
30.1
27.9
2.2
2.0
Indag Rubber
Neutral
205
-
537
286
326
19.8
16.8
11.7
13.3
17.5
15.4
3.0
2.8
17.8
17.1
1.5
1.4
Jamna Auto Industries
Neutral
237
-
1,890
1,486
1,620
9.8
9.9
15.0
17.2
15.8
13.8
3.5
2.9
21.8
21.3
1.3
1.2
JK Tyres
Neutral
162
-
3,666
7,455
8,056
15.0
15.0
21.8
24.5
7.4
6.6
1.6
1.3
22.8
21.3
0.6
0.5
L G Balakrishnan & Bros Neutral
629
-
987
1,302
1,432
11.6
11.9
43.7
53.0
14.4
11.9
2.0
1.9
13.8
14.2
0.9
0.8
Mahindra and Mahindra Neutral
1,351
-
83,882
46,534
53,077
11.6
11.7
67.3
78.1
20.1
17.3
3.3
2.9
15.4
15.8
1.8
1.5
Maruti
Neutral
6,407
-
193,546
67,822
83,288
16.0
16.4
253.8
312.4
25.2
20.5
5.8
4.7
23.0
22.9
2.5
2.0
Minda Industries
Neutral
470
-
3,731
2,728
3,042
9.0
9.1
68.2
86.2
6.9
5.5
1.6
1.2
23.8
24.3
1.4
1.2
Motherson Sumi
Neutral
386
-
54,171
45,896
53,687
7.8
8.3
13.0
16.1
29.6
24.0
9.5
7.6
34.7
35.4
1.3
1.1
Rane Brake Lining
Neutral
1,006
-
796
511
562
11.3
11.5
28.1
30.9
35.8
32.5
5.5
5.0
15.3
15.0
1.7
1.6
Setco Automotive
Neutral
42
-
560
741
837
13.0
13.0
15.2
17.0
2.8
2.5
0.5
0.4
15.8
16.3
1.1
1.0
Subros
Neutral
230
-
1,382
1,488
1,681
11.7
11.9
6.4
7.2
36.0
32.1
3.8
3.5
10.8
11.4
1.2
1.0
Swaraj Engines
Neutral
1,865
-
2,317
660
810
15.2
16.4
54.5
72.8
34.2
25.6
10.7
9.7
31.5
39.2
3.3
2.7
Tata Motors
Neutral
451
-
130,162
300,209
338,549
8.9
8.4
42.7
54.3
10.6
8.3
1.7
1.4
15.6
17.2
0.5
0.5
TVS Motor
Neutral
502
-
23,861
13,390
15,948
6.9
7.1
12.8
16.5
39.4
30.4
9.8
7.8
26.3
27.2
1.8
1.5
Capital Goods
ACE
Neutral
63
-
623
709
814
4.1
4.6
1.4
2.1
45.0
30.0
1.9
1.8
4.4
6.0
1.0
0.9
BEML
Neutral
1,423
-
5,926
3,451
4,055
6.3
9.2
31.4
57.9
45.3
24.6
2.7
2.5
6.3
10.9
1.8
1.5
BGR Energy
Neutral
165
-
1,187
16,567
33,848
6.0
5.6
7.8
5.9
21.1
27.9
1.2
1.2
4.7
4.2
0.2
0.1
Stock Watch
April 27, 2017
Company Name
Reco
CMP
Target
Mkt Cap
Sales ( Čcr )
OPM(%)
EPS (Č)
PER(x)
P/BV(x)
RoE(%)
EV/Sales(x)
(Č)
Price ( Č)
( Č cr )
FY17E
FY18E
FY17E
FY18E
FY17E
FY18E
FY17E
FY18E
FY17E
FY18E
FY17E
FY18E
FY17E
FY18E
Capital Goods
Bharat Electronics
Neutral
180
-
40,161
8,137
9,169
16.8
17.2
58.7
62.5
3.1
2.9
0.5
0.4
44.6
46.3
3.9
3.5
BHEL
Neutral
176
-
43,066
28,797
34,742
-
2.8
2.3
6.9
76.5
25.5
1.3
1.3
1.3
4.8
1.2
0.8
Blue Star
Accumulate
676
760
6,462
4,283
5,077
5.9
7.3
14.9
22.1
45.4
30.6
8.8
7.4
20.4
26.4
1.6
1.3
CG Power and Industrial
Neutral
78
-
4,892
5,777
6,120
5.9
7.0
3.3
4.5
23.7
17.3
1.0
1.0
4.4
5.9
0.8
0.7
Solutions
Greaves Cotton
Neutral
167
-
4,084
1,755
1,881
16.8
16.9
7.8
8.5
21.4
19.7
4.3
4.0
20.6
20.9
2.0
1.8
Inox Wind
Neutral
195
-
4,319
5,605
6,267
15.7
16.4
24.8
30.0
7.9
6.5
2.2
1.6
25.9
24.4
0.8
0.7
KEC International
Neutral
219
-
5,625
9,294
10,186
7.9
8.1
9.9
11.9
22.1
18.4
3.2
2.8
15.6
16.3
0.8
0.8
KEI Industries
Accumulate
213
239
1,656
2,682
3,058
10.4
10.0
11.7
12.8
18.1
16.6
3.6
3.0
20.1
18.2
0.8
0.7
Thermax
Neutral
1,028
-
12,251
5,421
5,940
7.3
7.3
25.7
30.2
40.0
34.0
4.8
4.4
12.2
13.1
2.1
2.0
VATech Wabag
Neutral
674
-
3,677
3,136
3,845
8.9
9.1
26.0
35.9
25.9
18.8
3.2
2.8
13.4
15.9
1.1
0.9
Voltas
Neutral
412
-
13,632
6,511
7,514
7.9
8.7
12.9
16.3
31.9
25.3
5.8
5.0
16.7
18.5
1.8
1.6
Cement
ACC
Neutral
1,603
-
30,101
11,225
13,172
13.2
16.9
44.5
75.5
36.0
21.2
3.4
3.1
11.2
14.2
2.7
2.3
Ambuja Cements
Neutral
246
-
48,926
9,350
10,979
18.2
22.5
5.8
9.5
42.5
25.9
3.6
3.2
10.2
12.5
5.2
4.5
India Cements
Neutral
205
-
6,299
4,364
4,997
18.5
19.2
7.9
11.3
26.0
18.2
1.9
1.8
8.0
8.5
2.2
1.9
J K Lakshmi Cement
Neutral
474
-
5,576
2,913
3,412
14.5
19.5
7.5
22.5
63.2
21.1
3.9
3.3
12.5
18.0
2.5
2.1
JK Cement
Neutral
951
-
6,650
4,398
5,173
15.5
17.5
31.2
55.5
30.5
17.1
3.7
3.2
12.0
15.5
2.1
1.7
Orient Cement
Neutral
158
-
3,237
2,114
2,558
18.5
20.5
8.1
11.3
19.5
14.0
2.9
2.4
9.0
14.0
2.2
1.7
UltraTech Cement
Neutral
4,233
-
116,198
25,768
30,385
21.0
23.5
111.0
160.0
38.1
26.5
4.9
4.3
13.5
15.8
4.6
3.8
Construction
Engineers India
Neutral
168
-
11,318
1,725
1,935
16.0
19.1
11.4
13.9
14.7
12.1
2.0
2.0
13.4
15.3
5.5
4.9
Gujarat Pipavav Port
Neutral
157
-
7,592
705
788
52.2
51.7
5.0
5.6
31.4
28.0
3.1
2.8
11.2
11.2
10.4
8.8
ITNL
Neutral
115
-
3,768
8,946
10,017
31.0
31.6
8.1
9.1
14.1
12.6
0.5
0.5
4.2
5.0
3.8
3.5
KNR Constructions
Neutral
195
-
2,743
1,385
1,673
14.7
14.0
41.2
48.5
4.7
4.0
0.9
0.8
14.9
15.2
2.1
1.7
Larsen & Toubro
Neutral
1,751
-
163,411
111,017
124,908
11.0
11.0
61.1
66.7
28.7
26.2
3.4
3.2
13.1
12.9
2.5
2.3
MEP Infra
Neutral
64
-
1,038
1,877
1,943
30.6
29.8
3.0
4.2
21.3
15.2
10.3
6.9
0.6
0.6
1.9
1.8
Nagarjuna Const.
Neutral
97
-
5,379
8,842
9,775
9.1
8.8
5.3
6.4
18.3
15.1
1.4
1.3
8.2
9.1
0.8
0.7
NBCC
Neutral
194
-
17,496
7,428
9,549
7.9
8.6
8.2
11.0
23.7
17.7
1.2
0.9
28.2
28.7
2.1
1.5
PNC Infratech
Neutral
155
-
3,965
2,350
2,904
13.1
13.2
9.0
8.8
17.2
17.6
0.6
0.6
15.9
13.9
1.8
1.5
Power Mech Projects
Neutral
551
-
811
1,801
2,219
12.7
14.6
72.1
113.9
7.6
4.8
1.4
1.2
16.8
11.9
0.5
0.3
Sadbhav Engineering
Neutral
325
-
5,576
3,598
4,140
10.3
10.6
9.0
11.9
36.1
27.3
3.8
3.3
9.9
11.9
1.8
1.6
Stock Watch
April 27, 2017
Company Name
Reco
CMP
Target
Mkt Cap
Sales ( Čcr )
OPM(%)
EPS (Č)
PER(x)
P/BV(x)
RoE(%)
EV/Sales(x)
(Č)
Price ( Č)
( Č cr )
FY17E
FY18E
FY17E
FY18E
FY17E
FY18E
FY17E
FY18E
FY17E
FY18E
FY17E
FY18E
FY17E
FY18E
Construction
Simplex Infra
Neutral
397
-
1,965
6,829
7,954
10.5
10.5
31.4
37.4
12.7
10.6
1.3
1.2
9.9
13.4
0.7
0.6
SIPL
Neutral
102
-
3,607
1,036
1,252
65.5
66.2
(8.4)
(5.6)
3.8
4.4
(22.8)
(15.9)
11.7
9.7
Financials
Axis Bank
Accumulate
517
580
123,920
46,932
53,575
3.5
3.4
32.4
44.6
16.0
11.6
2.1
1.8
13.6
16.5
-
-
Bank of Baroda
Neutral
182
-
41,844
19,980
23,178
1.8
1.8
11.5
17.3
15.8
10.5
1.8
1.5
8.3
10.1
-
-
Can Fin Homes
Neutral
2,550
-
6,787
420
526
3.5
3.5
86.5
107.8
29.5
23.7
6.3
5.2
23.6
24.1
-
-
Canara Bank
Neutral
330
-
19,708
15,225
16,836
1.8
1.8
14.5
28.0
22.8
11.8
1.6
1.3
5.8
8.5
-
-
Cholamandalam Inv. &
Accumulate
1,138
1,230
17,780
2,012
2,317
6.3
6.3
42.7
53.6
26.6
21.2
4.2
3.6
16.9
18.3
-
-
Fin. Co.
Dewan Housing Finance Accumulate
432
460
13,530
2,225
2,688
2.9
2.9
29.7
34.6
14.6
12.5
2.4
1.5
16.1
14.8
-
-
Equitas Holdings
Buy
167
235
5,650
939
1,281
11.7
11.5
5.8
8.2
28.8
20.4
2.5
2.2
10.9
11.5
-
-
Federal Bank
Buy
94
115
16,257
8,259
8,995
3.0
3.0
4.3
5.6
21.9
16.9
1.9
1.7
8.5
10.1
-
-
HDFC
Neutral
1,585
-
251,804
11,475
13,450
3.4
3.4
45.3
52.5
35.0
30.2
6.7
6.0
20.2
20.5
-
-
HDFC Bank
Accumulate
1,547
1,650
396,541
46,097
55,433
4.5
4.5
58.4
68.0
26.5
22.8
4.7
3.9
18.8
18.6
-
-
ICICI Bank
Accumulate
277
315
161,333
42,800
44,686
3.1
3.3
18.0
21.9
15.4
12.7
2.1
1.9
11.1
12.3
-
-
Karur Vysya Bank
Buy
117
140
7,055
5,640
6,030
3.3
3.2
8.9
10.0
13.1
11.7
1.4
1.3
11.2
11.4
-
-
Lakshmi Vilas Bank
Neutral
196
-
3,743
3,339
3,799
2.7
2.8
11.0
14.0
17.8
14.0
1.8
1.7
11.2
12.7
-
-
LIC Housing Finance
Neutral
676
-
34,105
3,712
4,293
2.6
2.5
39.0
46.0
17.3
14.7
3.3
2.8
19.9
20.1
-
-
Punjab Natl.Bank
Neutral
166
-
35,367
23,532
23,595
2.3
2.4
6.8
12.6
24.4
13.2
3.8
2.7
3.3
6.5
-
-
RBL Bank
Neutral
550
-
20,343
1,783
2,309
2.6
2.6
12.7
16.4
43.3
33.5
4.7
4.2
12.8
13.3
-
-
Repco Home Finance
Accumulate
766
825
4,791
388
457
4.5
4.2
30.0
38.0
25.5
20.2
4.3
3.6
18.0
19.2
-
-
South Ind.Bank
Neutral
24
-
4,354
6,435
7,578
2.5
2.5
2.7
3.1
8.9
7.8
1.2
1.0
10.1
11.2
-
-
St Bk of India
Neutral
286
-
232,266
88,650
98,335
2.6
2.6
13.5
18.8
21.2
15.2
2.0
1.8
7.0
8.5
-
-
Union Bank
Neutral
161
-
11,095
13,450
14,925
2.3
2.3
25.5
34.5
6.3
4.7
0.9
0.8
7.5
10.2
-
-
Yes Bank
Neutral
1,580
-
72,167
8,978
11,281
3.3
3.4
74.0
90.0
21.4
17.6
4.1
3.4
17.0
17.2
-
-
FMCG
Akzo Nobel India
Neutral
1,987
-
9,529
2,955
3,309
13.3
13.7
57.2
69.3
34.8
28.7
11.4
9.5
32.7
33.3
3.0
2.7
Asian Paints
Neutral
1,105
-
105,996
17,128
18,978
16.8
16.4
19.1
20.7
57.9
53.4
20.1
19.0
34.8
35.5
6.1
5.5
Britannia
Neutral
3,562
-
42,743
9,594
11,011
14.6
14.9
80.3
94.0
44.4
37.9
18.2
14.1
41.2
-
4.3
3.7
Colgate
Neutral
1,037
-
28,209
4,605
5,149
23.4
23.4
23.8
26.9
43.6
38.6
24.1
18.9
64.8
66.8
6.1
5.4
Dabur India
Neutral
294
-
51,824
8,315
9,405
19.8
20.7
8.1
9.2
36.3
32.0
10.1
8.4
31.6
31.0
5.9
5.2
GlaxoSmith Con*
Neutral
5,210
-
21,910
4,350
4,823
21.2
21.4
179.2
196.5
29.1
26.5
7.7
6.5
27.1
26.8
4.4
3.9
Stock Watch
April 27, 2017
Company Name
Reco
CMP
Target
Mkt Cap
Sales ( Čcr )
OPM(%)
EPS (Č)
PER(x)
P/BV(x)
RoE(%)
EV/Sales(x)
(Č)
Price ( Č)
( Č cr )
FY17E FY18E
FY17E
FY18E
FY17E
FY18E
FY17E
FY18E
FY17E
FY18E
FY17E
FY18E
FY17E
FY18E
FMCG
Godrej Consumer
Neutral
1,725
-
58,766
10,235
11,428
18.4
18.6
41.1
44.2
42.0
39.0
9.3
7.9
24.9
24.8
5.8
5.2
HUL
Neutral
941
-
203,633
35,252
38,495
17.8
17.8
20.7
22.4
45.6
42.0
43.6
37.4
95.6
88.9
5.6
5.1
ITC
Neutral
291
-
353,064
40,059
44,439
38.3
39.2
9.0
10.1
32.4
28.7
9.0
7.9
27.8
27.5
8.3
7.5
Marico
Neutral
323
-
41,650
6,430
7,349
18.8
19.5
6.4
7.7
50.4
41.9
15.2
12.8
33.2
32.5
6.3
5.4
Nestle*
Neutral
6,427
-
61,964
10,073
11,807
20.7
21.5
124.8
154.2
51.5
41.7
21.1
19.0
34.8
36.7
6.0
5.1
Procter & Gamble
Neutral
7,410
-
24,053
2,939
3,342
23.2
23.0
146.2
163.7
50.7
45.3
12.8
10.7
25.3
23.5
7.7
6.7
Hygiene
Tata Global
Neutral
154
-
9,704
8,675
9,088
9.8
9.8
7.4
8.2
20.8
18.8
1.6
1.6
7.9
8.1
1.0
1.0
IT
HCL Tech^
Buy
801
1,000
114,228
49,242
57,168
20.5
20.5
55.7
64.1
14.4
12.5
2.9
2.2
20.3
17.9
2.2
1.8
Infosys
Buy
914
1,179
209,952
68,484
73,963
26.0
26.0
63.0
64.0
14.5
14.3
3.1
2.8
20.8
19.7
2.7
2.4
TCS
Accumulate
2,310
2,651
455,258
117,966
127,403
27.5
27.6
134.3
144.5
17.2
16.0
5.1
4.8
29.8
29.7
3.5
3.3
Tech Mahindra
Buy
428
600
41,701
29,673
32,937
15.5
17.0
32.8
39.9
13.1
10.7
2.6
2.2
19.6
20.7
1.1
1.0
Wipro
Buy
491
583
119,320
55,440
60,430
18.1
18.1
36.1
38.9
13.6
12.6
2.4
2.3
19.0
17.6
1.9
1.7
Media
D B Corp
Neutral
379
-
6,962
2,297
2,590
27.4
28.2
21.0
23.4
18.0
16.2
4.2
3.6
23.7
23.1
2.8
2.4
Hindustan Media
Neutral
289
-
2,121
1,016
1,138
24.3
25.2
27.3
30.1
10.6
9.6
2.0
1.8
16.2
15.8
1.4
1.2
Ventures
HT Media
Neutral
82
-
1,914
2,693
2,991
12.6
12.9
7.9
9.0
10.4
9.1
0.9
0.8
7.8
8.3
0.3
0.2
Jagran Prakashan
Buy
194
225
6,331
2,355
2,635
28.0
28.0
10.8
12.5
17.9
15.5
3.9
3.4
21.7
21.7
2.7
2.4
Sun TV Network
Neutral
924
-
36,409
2,850
3,265
70.1
71.0
26.2
30.4
35.3
30.4
9.0
8.0
24.3
25.6
12.4
10.7
TV Today Network
Buy
268
344
1,598
567
645
26.7
27.0
15.4
18.1
17.4
14.8
2.6
2.3
14.9
15.2
2.4
2.0
Metals & Mining
Coal India
Neutral
277
-
171,883
84,638
94,297
21.4
22.3
24.5
27.1
11.3
10.2
4.7
4.5
42.6
46.0
1.5
1.4
Hind. Zinc
Neutral
273
-
115,330
14,252
18,465
55.9
48.3
15.8
21.5
17.3
12.7
2.8
2.5
17.0
20.7
8.1
6.3
Hindalco
Neutral
197
-
44,171
107,899
112,095
7.4
8.2
9.2
13.0
21.4
15.2
1.0
1.0
4.8
6.6
0.9
0.9
JSW Steel
Neutral
199
-
48,103
53,201
58,779
16.1
16.2
130.6
153.7
1.5
1.3
0.2
0.2
14.0
14.4
1.7
1.4
NMDC
Neutral
129
-
40,941
6,643
7,284
44.4
47.7
7.1
7.7
18.2
16.8
1.6
1.5
8.8
9.2
3.9
3.5
SAIL
Neutral
60
-
24,904
47,528
53,738
(0.7)
2.1
(1.9)
2.6
23.2
0.7
0.6
(1.6)
3.9
1.4
1.2
Tata Steel
Neutral
454
-
44,117
121,374
121,856
7.2
8.4
18.6
34.3
24.4
13.2
1.5
1.4
6.1
10.1
1.0
1.0
Vedanta
Neutral
235
-
69,522
71,744
81,944
19.2
21.7
13.4
20.1
17.5
11.7
1.5
1.3
8.4
11.3
1.4
1.1
Oil & Gas
Cairn India
#VALUE!
9,127
10,632
4.3
20.6
8.8
11.7
3.3
4.2
GAIL
Neutral
414
-
69,969
56,220
65,198
9.3
10.1
27.1
33.3
15.3
12.4
1.4
1.3
9.3
10.7
1.4
1.2
Indian Oil Corp
Neutral
434
-
210,625
373,359
428,656
5.9
5.5
54.0
59.3
8.0
7.3
1.2
1.1
16.0
15.6
0.7
0.6
Stock Watch
April 27, 2017
Company Name
Reco
CMP
Target
Mkt Cap
Sales ( Čcr )
OPM(%)
EPS (Č)
PER(x)
P/BV(x)
RoE(%)
EV/Sales(x)
(Č)
Price ( Č)
( Č cr )
FY17E FY18E
FY17E
FY18E
FY17E
FY18E
FY17E
FY18E
FY17E
FY18E
FY17E
FY18E
FY17E
FY18E
Oil & Gas
ONGC
Neutral
180
-
231,383
137,222
152,563
15.0
21.8
19.5
24.1
9.3
7.5
0.8
0.8
8.5
10.1
2.0
1.8
Reliance Industries
Neutral
1,416
-
460,503
301,963
358,039
12.1
12.6
87.7
101.7
16.2
13.9
1.7
1.5
10.7
11.3
2.0
1.7
Pharmaceuticals
Alembic Pharma
Accumulate
624
689
11,762
3,483
4,244
20.2
21.4
24.3
33.6
25.7
18.6
5.9
4.7
25.5
25.3
3.3
2.6
Alkem Laboratories Ltd
Buy
1,957
2,257
23,401
6,065
7,009
18.7
20.0
80.2
92.0
24.4
21.3
5.5
4.6
22.5
21.6
3.8
3.3
Aurobindo Pharma
Buy
625
877
36,606
15,720
18,078
23.7
23.7
41.4
47.3
15.1
13.2
3.9
3.1
29.6
26.1
2.6
2.2
Aventis*
Neutral
4,136
-
9,525
2,277
2,597
16.6
17.4
128.9
157.0
32.1
26.3
5.5
4.2
21.6
26.4
4.0
3.3
Cadila Healthcare
Neutral
453
-
46,411
10,429
12,318
17.7
21.6
13.1
19.2
34.6
23.6
7.2
5.8
22.8
27.1
4.5
3.7
Cipla
Sell
555
465
44,658
15,378
18,089
15.7
16.8
19.3
24.5
28.8
22.7
3.4
3.0
12.3
13.9
3.1
2.6
Dishman Pharma
Sell
320
143
5,165
1,718
1,890
22.7
22.8
9.5
11.3
33.7
28.3
3.3
3.0
10.1
10.9
3.5
3.1
Dr Reddy's
Neutral
2,611
-
43,259
16,043
18,119
18.0
23.0
78.6
130.9
33.2
20.0
3.2
2.9
10.1
15.2
2.5
2.4
GSK Pharma*
Neutral
2,551
-
21,605
2,800
3,290
10.2
20.6
32.2
60.3
79.2
42.3
14.7
14.5
17.2
34.5
7.5
6.4
Indoco Remedies
Accumulate
228
240
2,097
1,112
1,289
16.2
18.2
11.6
16.0
19.6
14.2
3.1
2.6
17.0
20.1
2.0
1.7
Ipca labs
Neutral
606
-
7,646
3,258
3,747
12.8
15.3
12.1
19.2
50.1
31.6
3.1
2.9
6.4
9.5
2.5
2.2
Lupin
Buy
1,371
1,809
61,922
15,912
18,644
26.4
26.7
58.1
69.3
23.6
19.8
4.6
3.8
21.4
20.9
4.0
3.3
Natco Pharma
Accumulate
921
974
16,053
2,090
2,335
32.1
26.6
26.8
23.2
34.3
39.7
9.7
8.4
28.4
21.1
7.7
95.1
Sun Pharma
Buy
643
847
154,187
31,129
35,258
32.0
32.9
30.2
35.3
21.3
18.2
3.5
2.9
20.0
20.1
4.5
3.8
Power
NTPC
Neutral
166
-
136,545
86,605
95,545
17.5
20.8
11.8
13.4
14.0
12.4
1.4
1.3
10.5
11.1
2.9
2.9
Power Grid
Accumulate
205
223
107,378
25,315
29,193
88.2
88.7
14.2
17.2
14.5
12.0
2.2
1.9
15.2
16.1
8.9
8.0
Tata Power
Neutral
85
-
22,991
36,916
39,557
17.4
27.1
5.1
6.3
16.7
13.5
1.5
1.4
9.0
10.3
1.6
1.5
Real Estate
MLIFE
Buy
423
522
1,736
1,152
1,300
22.7
24.6
29.9
35.8
14.1
11.8
1.0
1.0
7.6
8.6
2.2
1.9
Prestige Estate
Neutral
253
-
9,499
4,707
5,105
25.2
26.0
10.3
13.0
24.6
19.5
2.0
1.8
10.3
10.2
3.2
2.8
Telecom
Bharti Airtel
Neutral
358
-
143,087
105,086
114,808
34.5
34.7
12.2
16.4
29.3
21.8
2.0
1.9
6.8
8.4
2.3
2.0
Idea Cellular
Neutral
86
-
30,826
40,133
43,731
37.2
37.1
6.4
6.5
13.4
13.2
1.1
1.0
8.2
7.6
1.8
1.5
zOthers
Abbott India
Neutral
4,452
-
9,460
3,153
3,583
14.1
14.4
152.2
182.7
29.3
24.4
143.6
122.6
25.6
26.1
2.7
2.3
Asian Granito
Accumulate
384
405
1,155
1,060
1,169
12.2
12.5
12.7
15.9
30.3
24.2
2.9
2.6
9.5
10.7
1.4
1.2
Bajaj Electricals
Accumulate
347
395
3,511
4,801
5,351
5.7
6.2
10.4
13.7
33.3
25.3
4.1
3.7
12.4
14.5
0.7
0.7
Banco Products (India)
Neutral
228
-
1,632
1,353
1,471
12.3
12.4
14.5
16.3
15.7
14.0
21.7
19.6
14.5
14.6
1.1
123.3
Coffee Day Enterprises
Neutral
250
-
5,148
2,964
3,260
20.5
21.2
4.7
8.0
-
31.2
2.9
2.6
5.5
8.5
2.1
1.9
Ltd
Competent Automobiles Neutral
234
-
150
1,137
1,256
3.1
2.7
28.0
23.6
8.4
9.9
45.1
40.7
14.3
11.5
0.1
0.1
Stock Watch
April 27, 2017
Company Name
Reco
CMP
Target
Mkt Cap
Sales ( Čcr )
OPM(%)
EPS (Č)
PER(x)
P/BV(x)
RoE(%)
EV/Sales(x)
(Č)
Price ( Č)
( Č cr )
FY17E
FY18E
FY17E
FY18E
FY17E
FY18E
FY17E
FY18E
FY17E
FY18E
FY17E
FY18E
FY17E
FY18E
zOthers
Elecon Engineering
Neutral
61
-
684
1,482
1,660
13.7
14.5
3.9
5.8
15.6
10.5
3.7
3.4
7.8
10.9
0.8
0.7
Finolex Cables
Neutral
532
-
8,133
2,883
3,115
12.0
12.1
14.2
18.6
37.5
28.6
19.9
17.4
15.8
14.6
2.5
2.3
Garware Wall Ropes
Neutral
756
-
1,654
863
928
15.1
15.2
36.4
39.4
20.8
19.2
3.8
3.2
17.5
15.9
1.8
1.7
Goodyear India*
Neutral
905
-
2,087
1,598
1,704
10.4
10.2
49.4
52.6
18.3
17.2
84.6
74.2
18.2
17.0
1.0
141.7
Hitachi
Neutral
1,789
-
4,864
2,081
2,433
8.8
8.9
33.4
39.9
53.6
44.8
43.2
36.0
22.1
21.4
2.3
2.0
HSIL
Neutral
338
-
2,445
2,384
2,515
15.8
16.3
15.3
19.4
22.1
17.4
22.0
18.9
7.8
9.3
1.2
1.1
Interglobe Aviation
Neutral
1,116
-
40,325
21,122
26,005
14.5
27.6
110.7
132.1
10.1
8.5
60.3
43.1
168.5
201.1
1.9
1.5
Jyothy Laboratories
Neutral
411
-
7,473
1,440
2,052
11.5
13.0
8.5
10.0
48.4
41.1
11.7
10.9
18.6
19.3
5.5
3.8
Kirloskar Engines India
Neutral
395
-
5,712
2,554
2,800
9.9
10.0
10.5
12.1
37.6
32.6
15.7
14.9
10.7
11.7
1.9
1.7
Ltd
Linc Pen & Plastics
Neutral
300
-
443
382
420
9.3
9.5
13.5
15.7
22.2
19.1
3.8
3.3
17.1
17.3
1.2
1.1
M M Forgings
Neutral
612
-
739
546
608
20.4
20.7
41.3
48.7
14.8
12.6
83.8
74.2
16.6
17.0
1.2
1.1
Manpasand Bever.
Neutral
706
-
4,037
836
1,087
19.6
19.4
16.9
23.8
41.8
29.6
5.0
4.4
12.0
14.8
4.6
3.4
Mirza International
Neutral
112
-
1,343
963
1,069
17.2
18.0
6.1
7.5
18.2
14.9
2.8
2.4
15.0
15.7
1.6
1.4
MT Educare
Neutral
82
-
326
366
417
17.7
18.2
9.4
10.8
8.7
7.6
1.9
1.7
22.2
22.3
0.8
0.7
Narayana Hrudaya
Neutral
317
-
6,484
1,873
2,166
11.5
11.7
2.6
4.0
120.0
80.0
7.4
6.7
6.1
8.3
3.6
3.1
Navkar Corporation
Buy
209
265
2,981
369
561
42.9
42.3
6.9
11.5
30.3
18.2
2.1
1.9
7.4
10.5
9.1
6.0
Navneet Education
Neutral
171
-
3,986
1,062
1,147
24.0
24.0
6.1
6.6
28.0
25.8
5.8
5.1
20.6
19.8
3.8
3.5
Nilkamal
Neutral
2,194
-
3,274
1,995
2,165
10.7
10.4
69.8
80.6
31.4
27.2
125.4
108.9
16.6
16.5
1.6
1.5
Page Industries
Neutral
14,234
-
15,877
2,450
3,124
20.1
17.6
299.0
310.0
47.6
45.9
317.0
242.0
47.1
87.5
6.5
5.1
Parag Milk Foods
Neutral
247
-
2,074
1,919
2,231
9.3
9.6
9.5
12.9
26.1
19.1
4.1
3.3
15.5
17.5
1.2
1.1
Quick Heal
Neutral
245
-
1,721
408
495
27.3
27.0
7.7
8.8
31.7
27.9
2.9
3.0
9.3
10.6
3.4
2.8
Radico Khaitan
Buy
122
147
1,626
1,667
1,824
13.0
13.2
6.7
8.2
18.4
14.9
1.7
1.5
9.0
10.2
1.4
1.2
Relaxo Footwears
Neutral
487
-
5,855
2,085
2,469
9.2
8.2
7.6
8.0
64.5
61.3
25.0
21.3
17.9
18.8
2.9
2.5
S H Kelkar & Co.
Neutral
321
-
4,642
1,036
1,160
15.1
15.0
6.1
7.2
52.6
44.7
5.6
5.2
10.7
11.5
4.4
3.8
Siyaram Silk Mills
Accumulate
1,701
1,872
1,594
1,652
1,857
11.6
11.7
92.4
110.1
18.4
15.4
2.7
2.4
14.7
15.2
1.2
1.0
Styrolution ABS India*
Neutral
741
-
1,304
1,440
1,537
9.2
9.0
40.6
42.6
18.3
17.4
46.6
42.4
12.3
11.6
0.9
0.8
Surya Roshni
Neutral
222
-
973
3,342
3,625
7.8
7.5
17.3
19.8
12.9
11.2
24.4
19.6
10.5
10.8
0.5
0.5
Team Lease Serv.
Neutral
1,055
-
1,803
3,229
4,001
1.5
1.8
22.8
32.8
46.3
32.1
5.0
4.3
10.7
13.4
0.5
0.4
The Byke Hospitality
Neutral
209
-
837
287
384
20.5
20.5
7.6
10.7
27.5
19.5
5.7
4.6
20.7
23.5
2.9
2.2
Stock Watch
April 27, 2017
Company Name
Reco
CMP
Target Mkt Cap
Sales ( Čcr )
OPM(%)
EPS (Č)
PER(x)
P/BV(x)
RoE(%)
EV/Sales(x)
(Č)
Price ( Č)
( Č cr )
FY17E FY18E FY17E FY18E FY17E FY18E FY17E FY18E FY17E FY18E FY17E FY18E FY17E FY18E
zOthers
Transport Corporation of
Neutral
237
-
1,813
2,671
2,911
8.5
8.8
13.9
15.7
17.1
15.1
2.3
2.1
13.7
13.8
0.8
0.7
India
TVS Srichakra
Neutral
4,194
-
3,211
2,304
2,614
13.7
13.8
231.1
266.6
18.1
15.7
471.2
371.0
33.9
29.3
1.4
1.2
UFO Moviez
Neutral
445
-
1,229
619
685
33.2
33.4
30.0
34.9
14.9
12.8
2.1
1.8
13.8
13.9
1.7
1.4
Visaka Industries
Neutral
333
-
529
1,051
1,138
10.3
10.4
21.0
23.1
15.9
14.4
42.7
40.0
9.0
9.2
0.8
0.7
VRL Logistics
Neutral
339
-
3,092
1,902
2,119
16.7
16.6
14.6
16.8
23.3
20.1
5.1
4.5
21.9
22.2
1.7
1.5
Wonderla Holidays
Neutral
391
-
2,210
287
355
38.0
40.0
11.3
14.2
34.6
27.5
5.0
4.3
21.4
23.9
7.4
6.0
VIP Industries
Accumulate
196
218
2,771
1,270
1,450
10.4
10.4
5.6
6.5
35.0
30.2
7.3
6.3
20.7
21.1
2.2
1.9
Navin Fluorine
Accumulate
3,188
3,650
3,121
789
945
21.1
22.4
120.1
143.4
26.5
22.2
4.3
3.7
17.8
18.5
3.9
3.2
Source: Company, Angel Research; Note: *December year end; #September year end; &October year end; Price as on April 26, 2017
Market Outlook
April 27, 2017
Research Team Tel: 022 - 39357800
DISCLAIMER
Angel Broking Private Limited (hereinafter referred to as “Angel”) is a registered Member of National Stock Exchange of India
Limited,Bombay Stock Exchange Limited and Metropolitan Stock Exchange Limited. It is also registered as a Depository Participant with
CDSL and Portfolio Manager with SEBI. It also has registration with AMFI as a Mutual Fund Distributor. Angel Broking Private Limited is a
registered entity with SEBI for Research Analyst in terms of SEBI (Research Analyst) Regulations, 2014 vide registration number
INH000000164. Angel or its associates has not been debarred/ suspended by SEBI or any other regulatory authority for accessing
/dealing in securities Market. Angel or its associates/analyst has not received any compensation / managed or
co-managed public offering of securities of the company covered by Analyst during the past twelve months.
This document is solely for the personal information of the recipient, and must not be singularly used as the basis of any investment
decision. Nothing in this document should be construed as investment or financial advice. Each recipient of this document should make
such investigations as they deem necessary to arrive at an independent evaluation of an investment in the securities of the companies
referred to in this document (including the merits and risks involved), and should consult their own advisors to determine the merits and
risks of such an investment.
Reports based on technical and derivative analysis center on studying charts of a stock's price movement, outstanding positions and
trading volume, as opposed to focusing on a company's fundamentals and, as such, may not match with a report on a company's
fundamentals. Investors are advised to refer the Fundamental and Technical Research Reports available on our website to evaluate the
contrary view, if any.
The information in this document has been printed on the basis of publicly available information, internal data and other reliable
sources believed to be true, but we do not represent that it is accurate or complete and it should not be relied on as such, as this
document is for general guidance only. Angel Broking Pvt. Limited or any of its affiliates/ group companies shall not be in any way
responsible for any loss or damage that may arise to any person from any inadvertent error in the information contained in this report.
Angel Broking Pvt. Limited has not independently verified all the information contained within this document. Accordingly, we cannot
testify, nor make any representation or warranty, express or implied, to the accuracy, contents or data contained within this document.
While Angel Broking Pvt. Limited endeavors to update on a reasonable basis the information discussed in this material, there may be
regulatory, compliance, or other reasons that prevent us from doing so.
This document is being supplied to you solely for your information, and its contents, information or data may not be reproduced,
redistributed or passed on, directly or indirectly.
Neither Angel Broking Pvt. Limited, nor its directors, employees or affiliates shall be liable for any loss or damage that may arise from
or in connection with the use of this information.